
A Look at the National Debt, Your Future Taxes, and What to Do About It
The U.S. Treasury announced last week that the national debt has passed $40 trillion. Here is what the number means, why it keeps growing, what it is likely to do to your taxes — and what all of that should and should not change about your financial plan.

How we got here
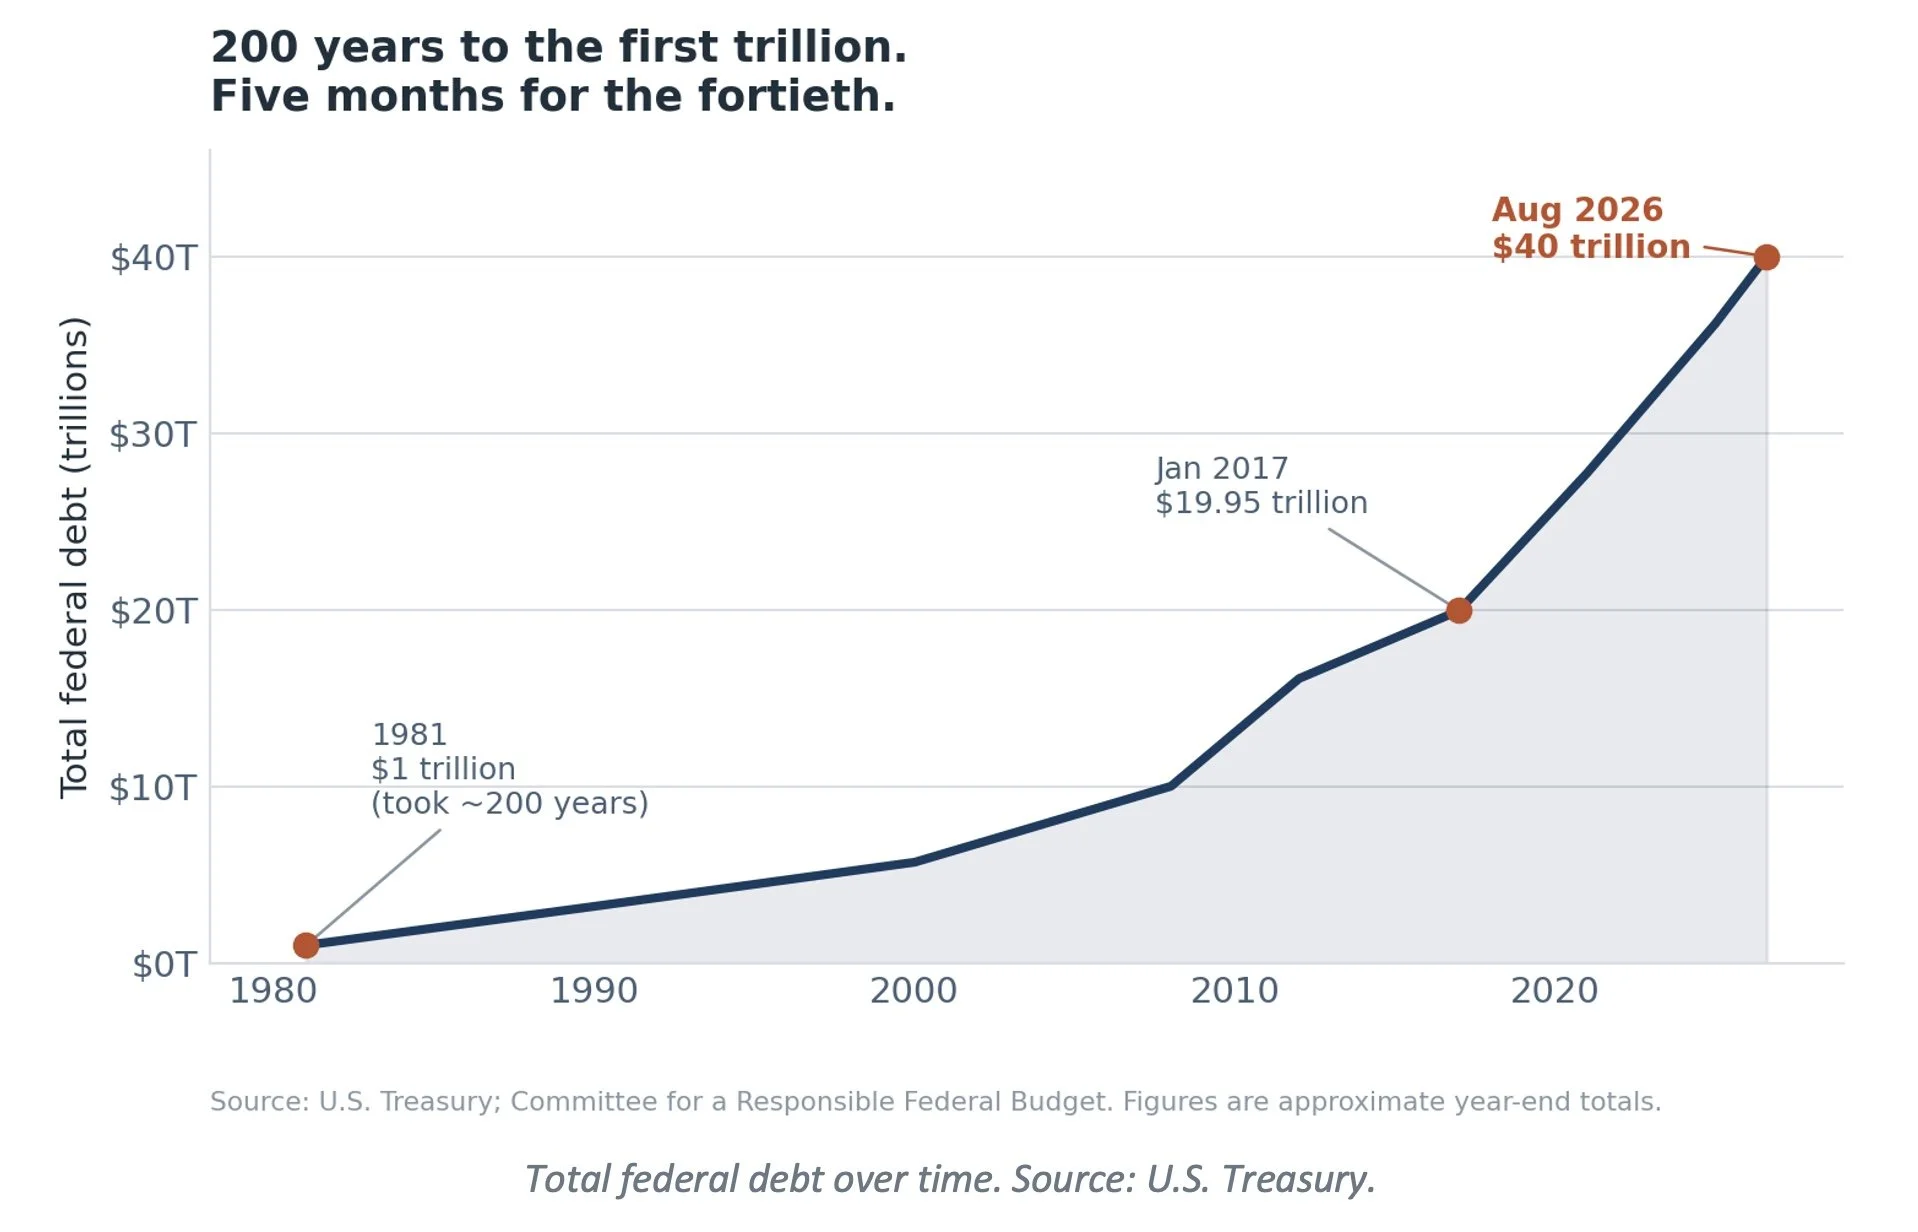
It took the United States nearly 200 years to borrow its first trillion dollars, which it did in 1981. The most recent trillion took under five months. Total debt has doubled since January 2017.
Debt has grown under every recent president. But the totals don't tell you why, and the why is what matters.
Some borrowing is a response to an emergency. When the economy breaks down, the government spends more to keep people afloat at exactly the moment tax revenue is falling. That describes most of the borrowing under President Obama during the financial crisis, and most of it under President Biden during COVID. You can argue about whether they spent too much. You can't argue there was no fire to put out.
Other borrowing is a choice made when nothing is burning. That is the category most of the last decade's tax legislation falls into.
Here is how it breaks down. The Committee for a Responsible Federal Budget, a nonpartisan budget watchdog, adds up how much new borrowing each president actually signed for. For President Trump's first term, the total came to about $8.4 trillion. Roughly $3.6 trillion of that was pandemic relief. The other $4.8 trillion was not. The single biggest piece was the 2017 tax cut, at about $2.5 trillion — signed when unemployment was near a fifty-year low and the deficit was already growing.
The same thing happened again last year. The 2025 tax law made most of the 2017 cuts permanent and raised the government's borrowing limit by nearly $5 trillion. The Congressional Budget Office estimates it will add about $4.1 trillion to the debt over ten years, and closer to $5.5 trillion if the provisions written to expire get extended instead — which is what usually happens. This time there was no pandemic, no recession, and no emergency to pay for.
Two other choices are adding to it now. Defense spending has climbed toward roughly $1.5 trillion requested for the coming year, driven by a conflict in the Middle East that was expected to last about six weeks, is getting more contentious, and has run months past that. And the tax cuts themselves are tilted upward: the largest single piece was cutting the corporate tax rate from 35% to 21%, and in dollar terms the benefits go disproportionately to high-income and ultra-high net worth households.
Analysts have said as much directly. Michael Ryan, a finance expert quoted by Newsweek this week, noted that no recent president gets a clean pass on the debt, but that “Bush and Trump deserve particularly hard scrutiny” — because both inherited a strong economy and chose large tax cuts anyway, with deficits already rising.
Our view: the slow forces behind the debt — an aging population, rising interest costs — are real, and they predate anyone currently in office. But those forces explain a debt that rises. They don't explain one that accelerates. What has accelerated it is a decade of tax cuts enacted in good times, now stacked on top of an expensive and open-ended war. Those were decisions, not emergencies.
Why it keeps growing
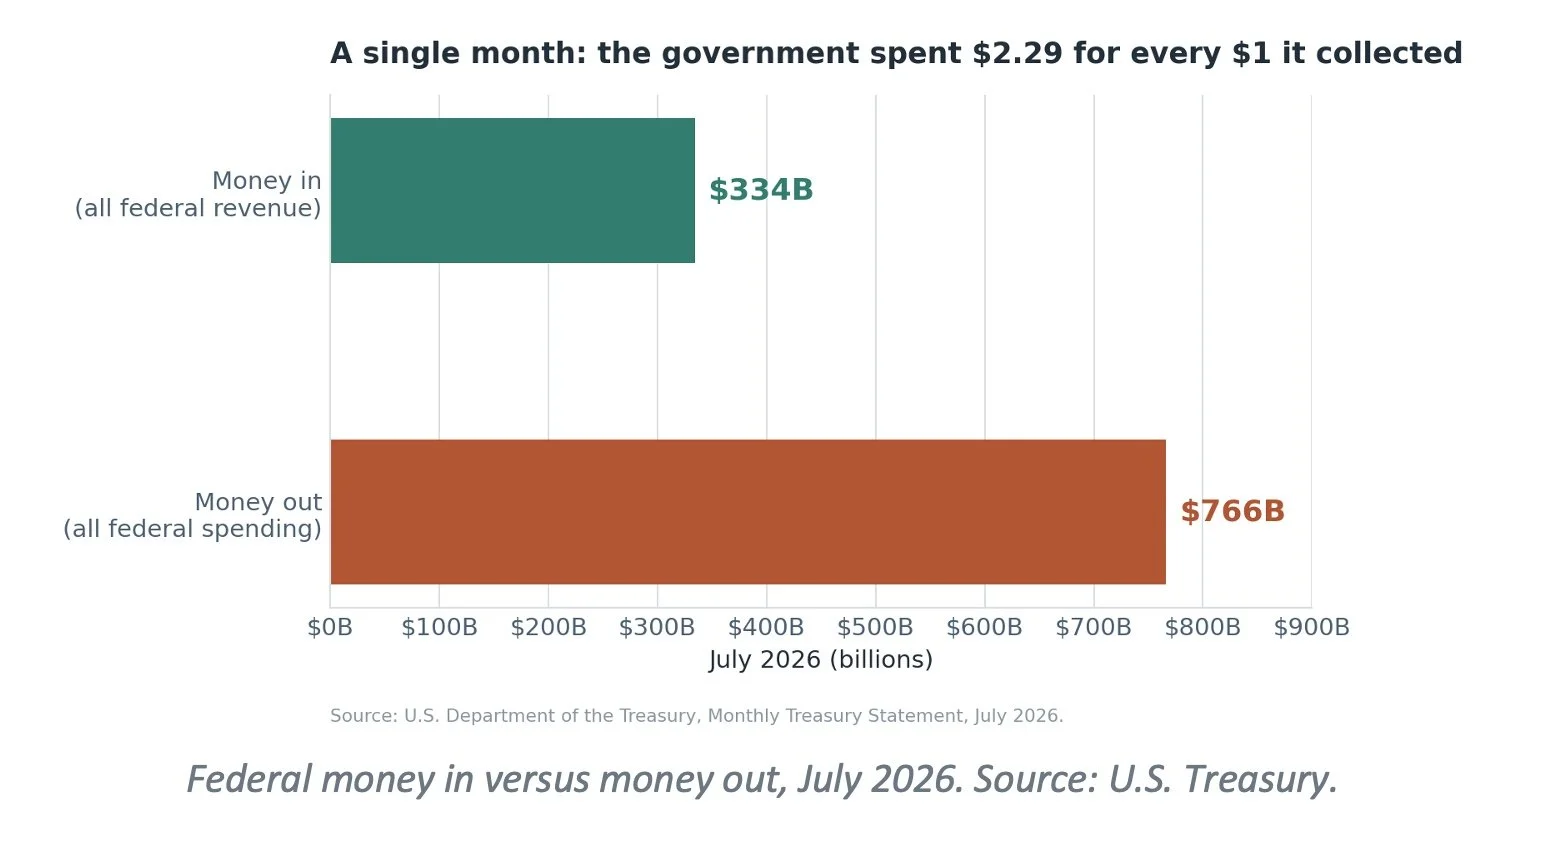
Underneath the politics is simple arithmetic: the government spends more than it collects, every single month. In July it took in $334 billion and paid out $766 billion. The difference is covered by borrowing.
Five things drive that gap:
An aging population. About 60% of federal spending goes to Social Security, Medicare, Medicaid and veterans' care. As the baby boomers retire, more people collect while relatively fewer workers pay in.
Fewer workers — which means fewer taxpayers. The foreign-born workforce has shrunk by roughly a million since early 2025, at a time when budget forecasters had assumed it would grow by more than a million. Fewer workers means fewer people paying payroll taxes, and the CBO estimates that recent immigration policy changes have added about $500 billion to federal deficits over the next decade — largely through lost payroll tax revenue, the same revenue that funds Social Security and Medicare. This runs against the common assumption that immigrants are a drain on the budget. There is a narrow version of that claim that holds up: immigrants with less than a high school education do cost more than they pay in during their first generation here, mostly at the state and local level, where K–12 and emergency care costs land. But the broad version doesn't survive the arithmetic. Even the Manhattan Institute report arguing against low-skilled immigration found that the average new immigrant reduces the federal deficit by roughly $10,000 over a lifetime, while the average native-born American costs the government more than $250,000. The right question is “a cost compared to whom?” When Washington spends 21% of GDP and collects 17%, most of us are a net fiscal cost — that gap is the deficit. Immigrants come out ahead of the average mainly because they arrive around age 29, so the United States never pays for their childhood or their schooling.
Two crises in twenty years. The 2008 financial crisis and the COVID pandemic each required enormous emergency borrowing — and spending never fully returned to its earlier level.
Tax cuts that outpaced spending cuts. Reductions in 2017 and 2025 lowered revenue without a matching reduction in what the government has promised to pay out. Sure, the current administration tried reducing spending, but very quickly found out how difficult it was to do this, and ultimately gave up reducing spending altogether.
Interest on the debt itself. When rates were near zero, a big debt was cheap to carry. Now it isn't. Interest costs roughly $1.1 trillion a year — more than the entire defense budget — and it buys nothing: no roads, no benefits, no services.
The hinge: bond interest rates
Our last point about interest rates deserves unpacking, because it’s confusing to most of us. Interest rates are what connect a number in Washington to the cost of your mortgage and the return on your savings.
Start with what a bond yield actually is. When the government needs money, it sells Treasury bonds — an IOU with a fixed repayment schedule. The yield is simply the return investors demand in exchange for lending the government money. It is a price, set by supply and demand in an open market. This is worth emphasizing because it is widely misunderstood: the Federal Reserve sets only the shortest-term rate. The 10-year and 30-year rates that matter most to households are set by investors, and they can move against the Fed's wishes. This has been happening in earnest lately.
Where they are now. The 10-year Treasury yields about 4.74%, the highest in roughly 20 months. The 30-year recently touched 5.34%, a level not seen in about 19 years. The long end is rising faster than the short end — this is the market's way of saying its concern is about the distant future of our economic situation, not the next few months.
Four forces are pushing them up:
Supply. The Treasury is auctioning record volumes of new bonds. When any seller floods a market, buyers gain leverage — and buyers with leverage demand a better price, which for bonds means a higher yield.
Inflation. Consumer prices are still rising about 3.4% a year, above the Fed's 2% target. No investor lends for thirty years at a rate that loses to inflation, so persistent inflation gets built into the price.
A fiscal risk premium. Investors are not pricing one bond auction; they are pricing what borrowing looks like in 2035. On August 19 the Treasury announced it would at least double its buybacks of long-dated bonds to support prices. Yields fell for part of one day, then erased the move entirely. The market's message was clear: that the plan was too small to change anything structural.
Competition for capital. Borrowing by large technology companies building AI infrastructure has gone from roughly $30 billion to about $800 billion this year. That debt doesn't add a dollar to the federal total, but it competes for the same pool of investor money — and pushes up the price of borrowing for everyone, Washington included.
Before this starts to sound like a crisis, some context: today's rates are not unusual — they are close to what Americans paid for most of the last century.
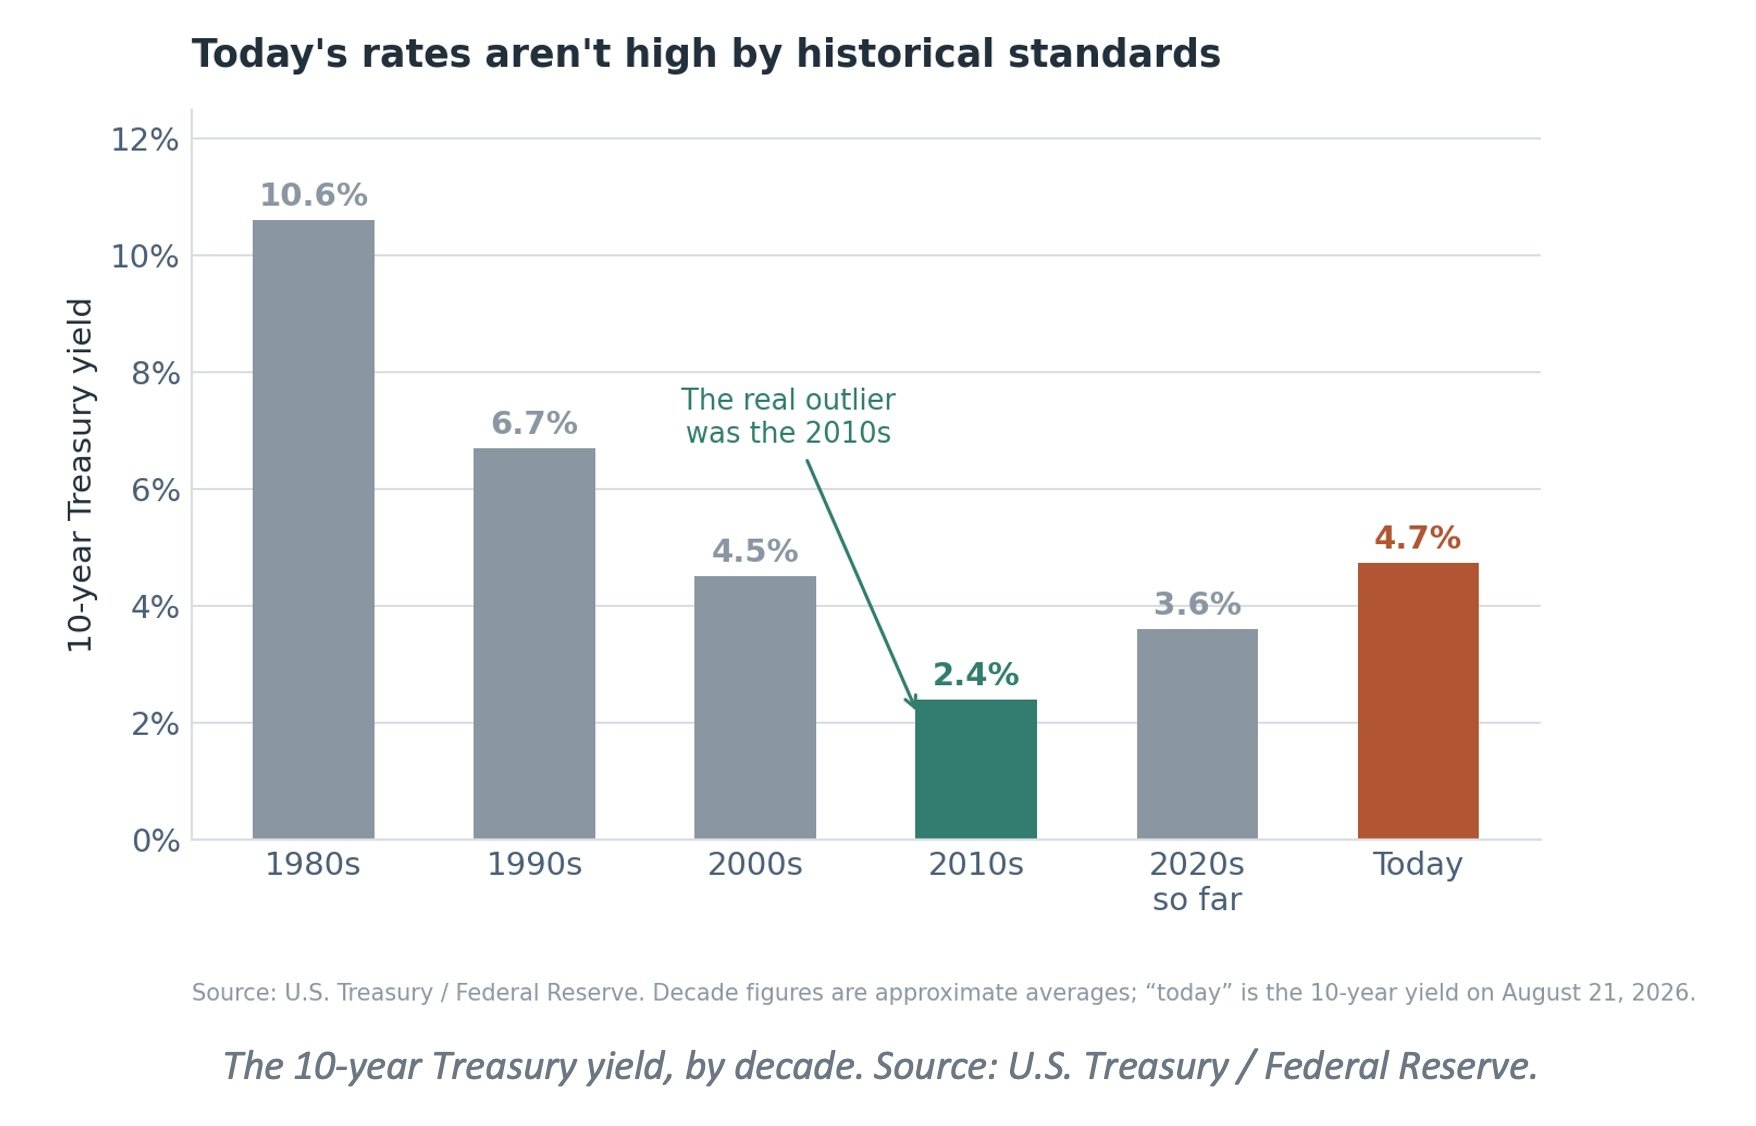
The decade that followed the 2008 financial crisis — when mortgages were near 3% and savers earned nothing — was the exception, not the baseline. Much of what feels like a crisis is really the end of an unusually cheap era. That is expensive for anyone who needs to borrow now, but it is not evidence that investors have lost faith in the United States.
Why the government cares. Roughly $32 trillion of the debt is held by investors and has to be refinanced as older bonds mature. Every one percentage point of additional interest costs the government about $320 billion a year once it fully works through — roughly half the defense budget, spent on nothing but the past.
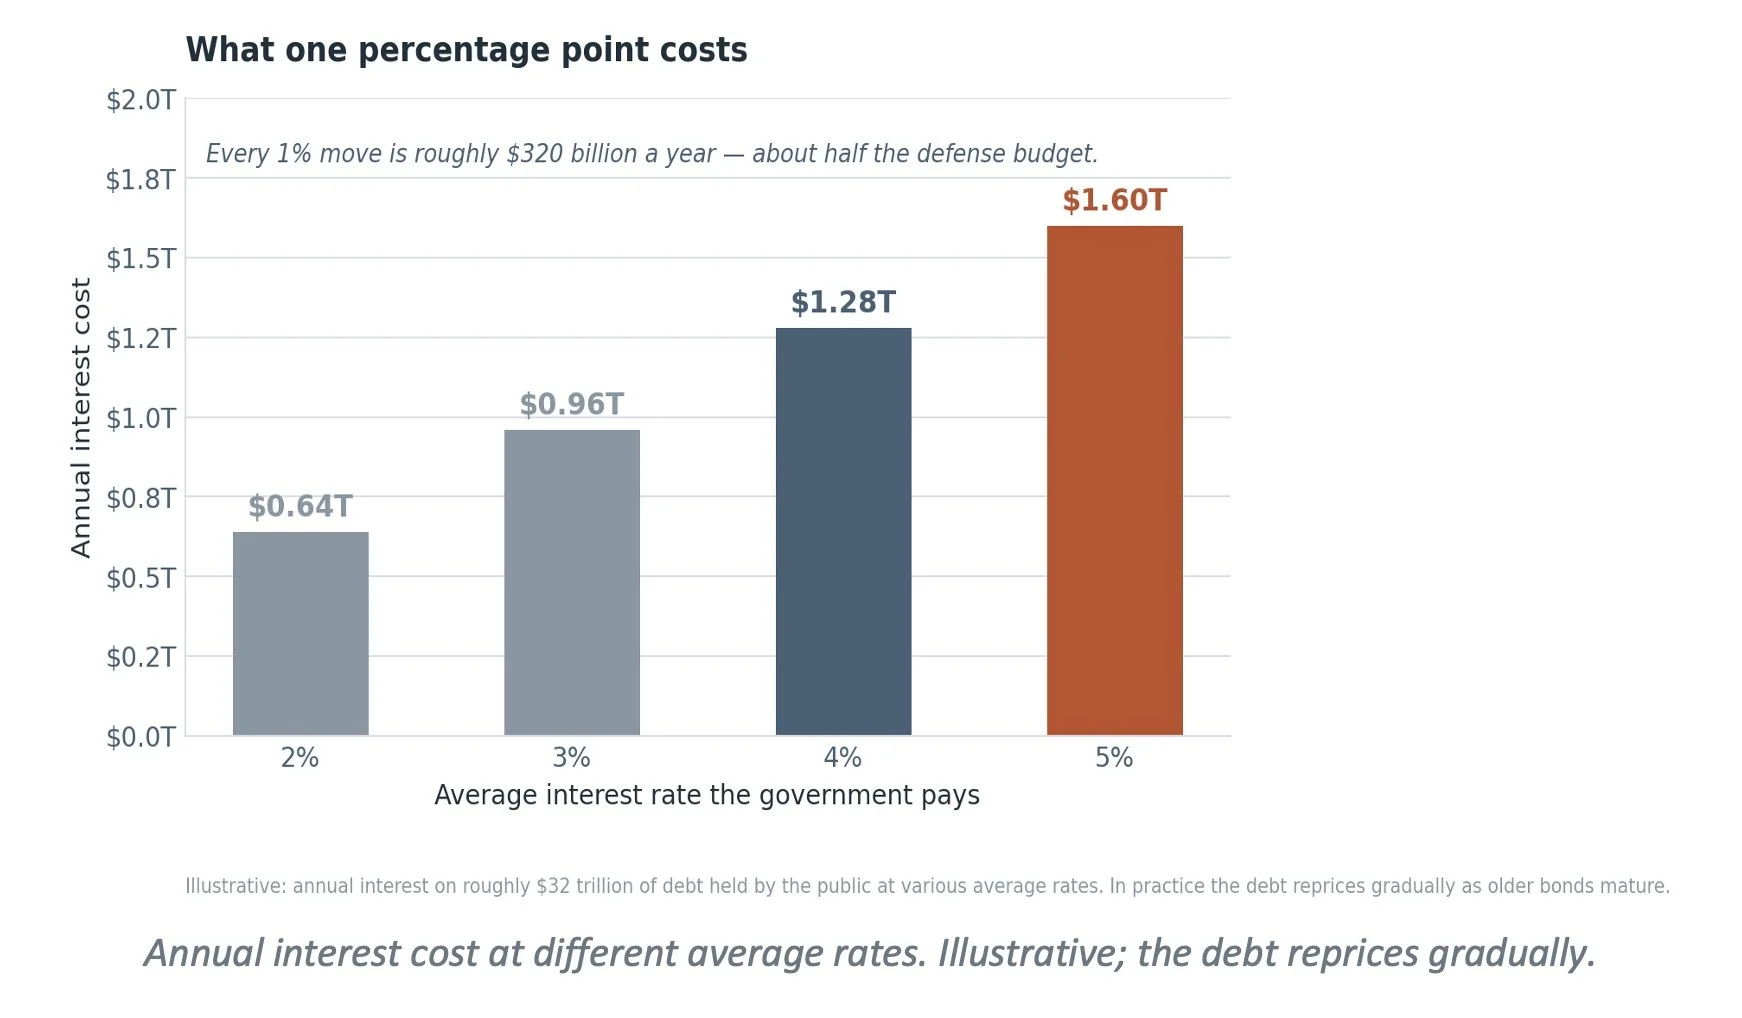
That is the loop economists worry about: more debt means more borrowing, more borrowing pushes rates up, higher rates make the debt more expensive, and the added interest becomes more debt. It is never dramatic in any single year. It simply compounds.
Why it matters to you
The government's borrowing costs set the floor for everyone else's. When Washington pays more to borrow, so do you. Here's how that shows up:
Mortgages and loans. The 30-year mortgage is averaging about 6.65%, and it tracks the government's own borrowing rate closely. Higher rates ripple outward from there — into home prices, construction, new business formation, infrastructure, and research. When money costs more, it gets spent on fewer things that drive our economy upward.
Inflation. Large deficits push prices up at the margin, and inflation is historically how big debts get quietly reduced. So there's a conflict: reduce debt through inflation or pay more in tax revenue. There's a reason financial planners call inflation the silent killer: you barely notice it in any single year, then look up a decade later and find your dollar buys noticeably less. It falls hardest on savers and people living on a fixed income.
Your bonds and your savings. This one cuts the other way. Higher rates knock down the price of bonds you already own, but every new dollar you invest earns more — and for the first time in about fifteen years, high-quality bonds and CDs pay a return that beats inflation. For retirees drawing income, that is a genuine improvement.
Slower growth. Money lent to the government isn't invested in businesses. Over time that means a smaller economy carrying the same debt.
Your future taxes. This is the big one, and it deserves its own section.
The part most media coverage leaves out
Most coverage stops at ringing an alarm bell. The fuller picture is more useful, and it turns on a fact that surprises most people: the United States is among the most lightly taxed wealthy countries in the world. Add up every tax at every level of government, and America collects about 25% of its economy. Comparatively, Germany collects 38%. France collects 42%.
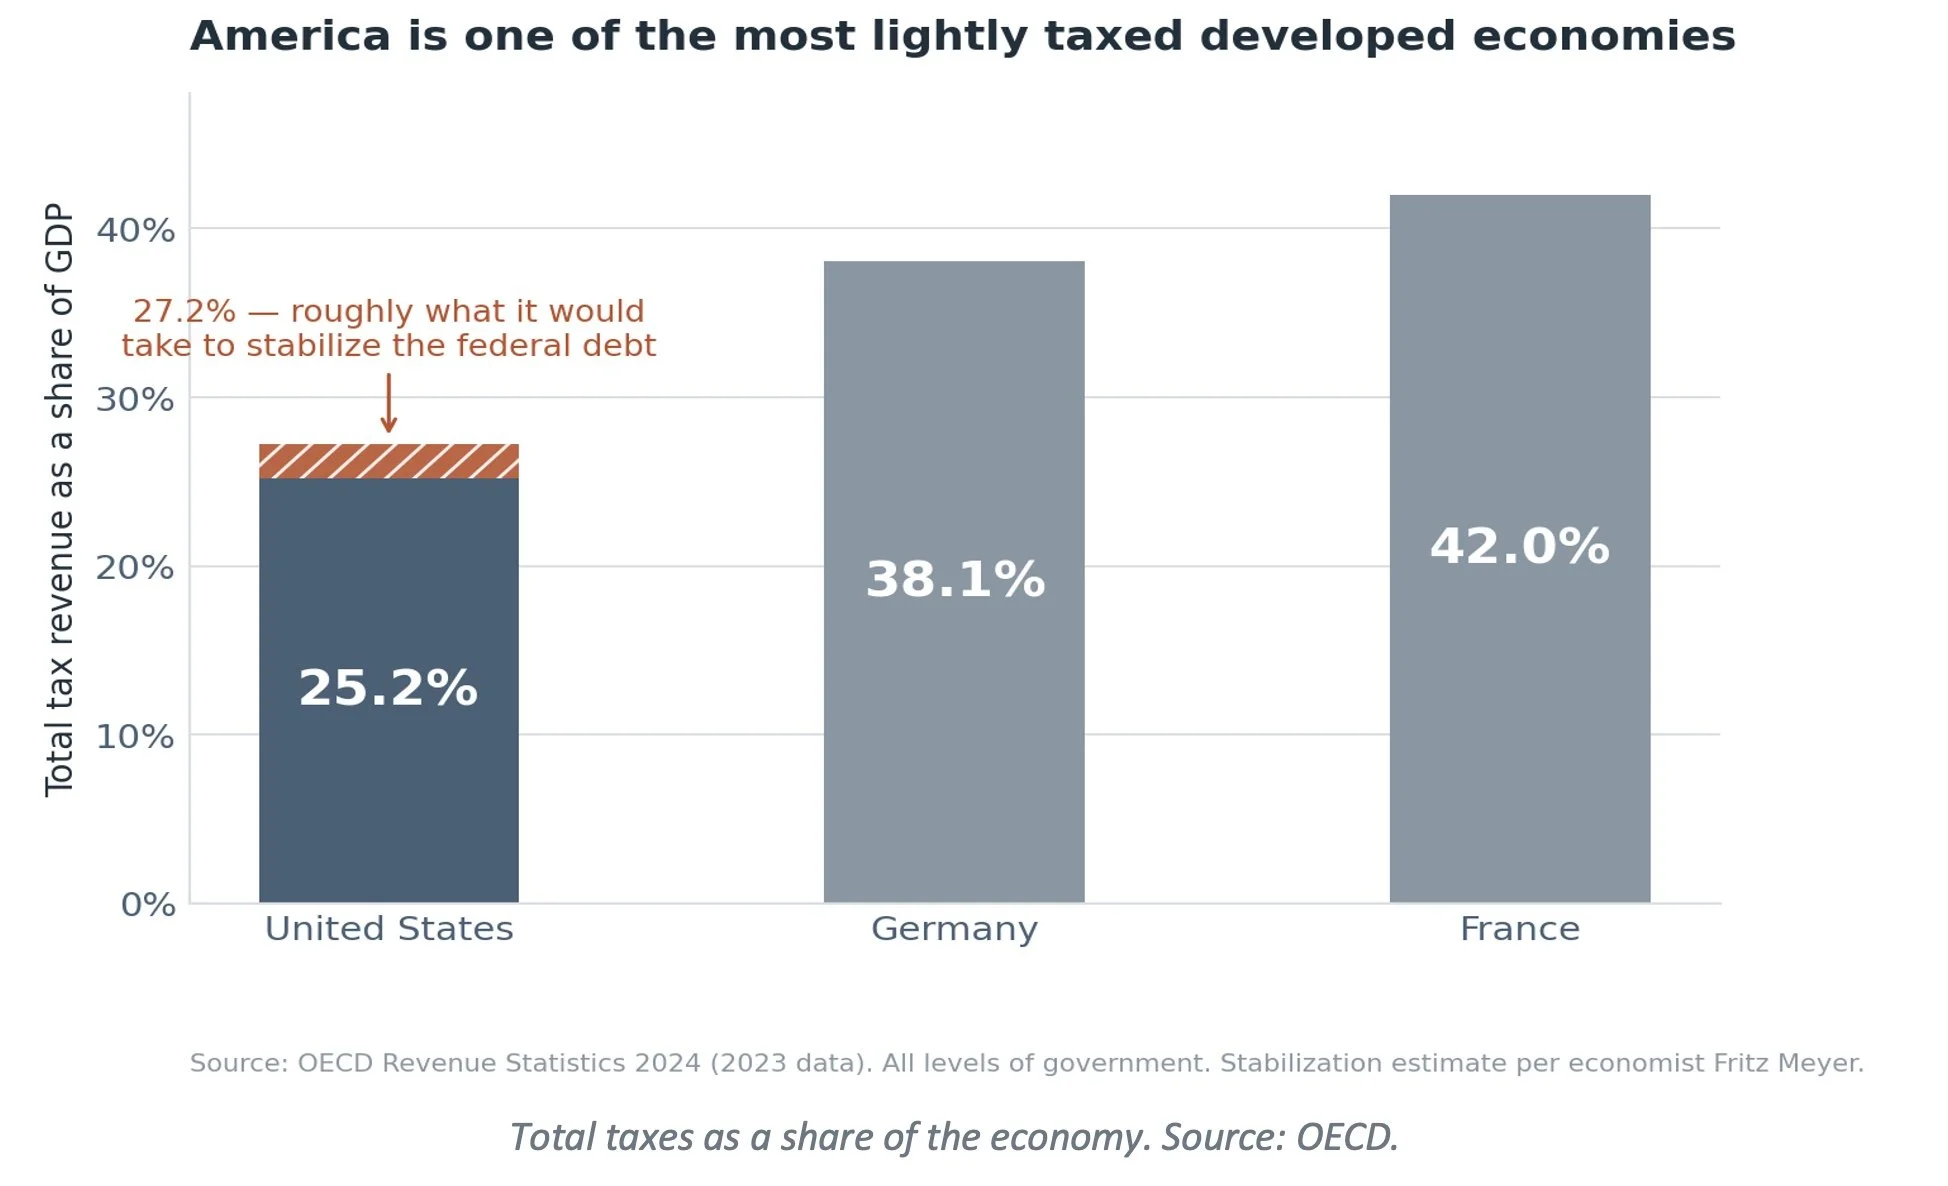
That matters, because it means the problem is solvable. Independent economist Fritz Meyer, whose analysis we follow, estimates that raising America's total tax take by about two percentage points — from roughly 25% to 27% of the economy — would be enough to stop the debt from outrunning the economy. That would still leave our country far more lightly taxed than most of Europe.
Is that feasible? Arithmetically, yes, and with room to spare. The obstacle has never been capacity — it has been political will, and will of that kind tends to show up only when a deadline or an emergency forces it. Our expectation is that this gets dealt with not in the next presidential term but the one after, when the Social Security deadline described below makes it unavoidable.
And make no mistake, it would arrive as a genuine national emergency. Social Security provides at least half the income for roughly half of American retirees, and close to all of it for about one in four. An automatic cut in 2033 wouldn't be limited to the heavily-dependent group. It would reduce checks for all 70 million beneficiaries at once. And the 14 million beneficiaries — roughly one in four — who rely on Social Security retirement benefits for almost all of their income, have little or no other income to absorb the reduction. An automatic across-the-board cut wouldn't be a budget-line adjustment for those households — it would be a reduction in the money they live on, also arriving with no time to plan around it. In no uncertain terms, this would be a national emergency and would have the potential to add even more to our national deficit and debt through greater emergency spending to address poverty-related problems.
Meyer's other conclusion is the one that should get your attention, and we agree: he does not expect spending to be cut. Social Security, Medicare, and defense are where the money goes, and there is little political constituency or motivation among our leaders to cut any of the three. If the arithmetic must close and spending won't move, taxes are what must go up.
The date to watch: 2033
Social Security's trustees project that the program's trust fund runs dry in early 2033. That does not mean benefits stop — incoming payroll taxes would still cover roughly three-quarters of what is scheduled. But without legislation, the rest is cut automatically.
The choices are well quantified, and waiting makes them worse.
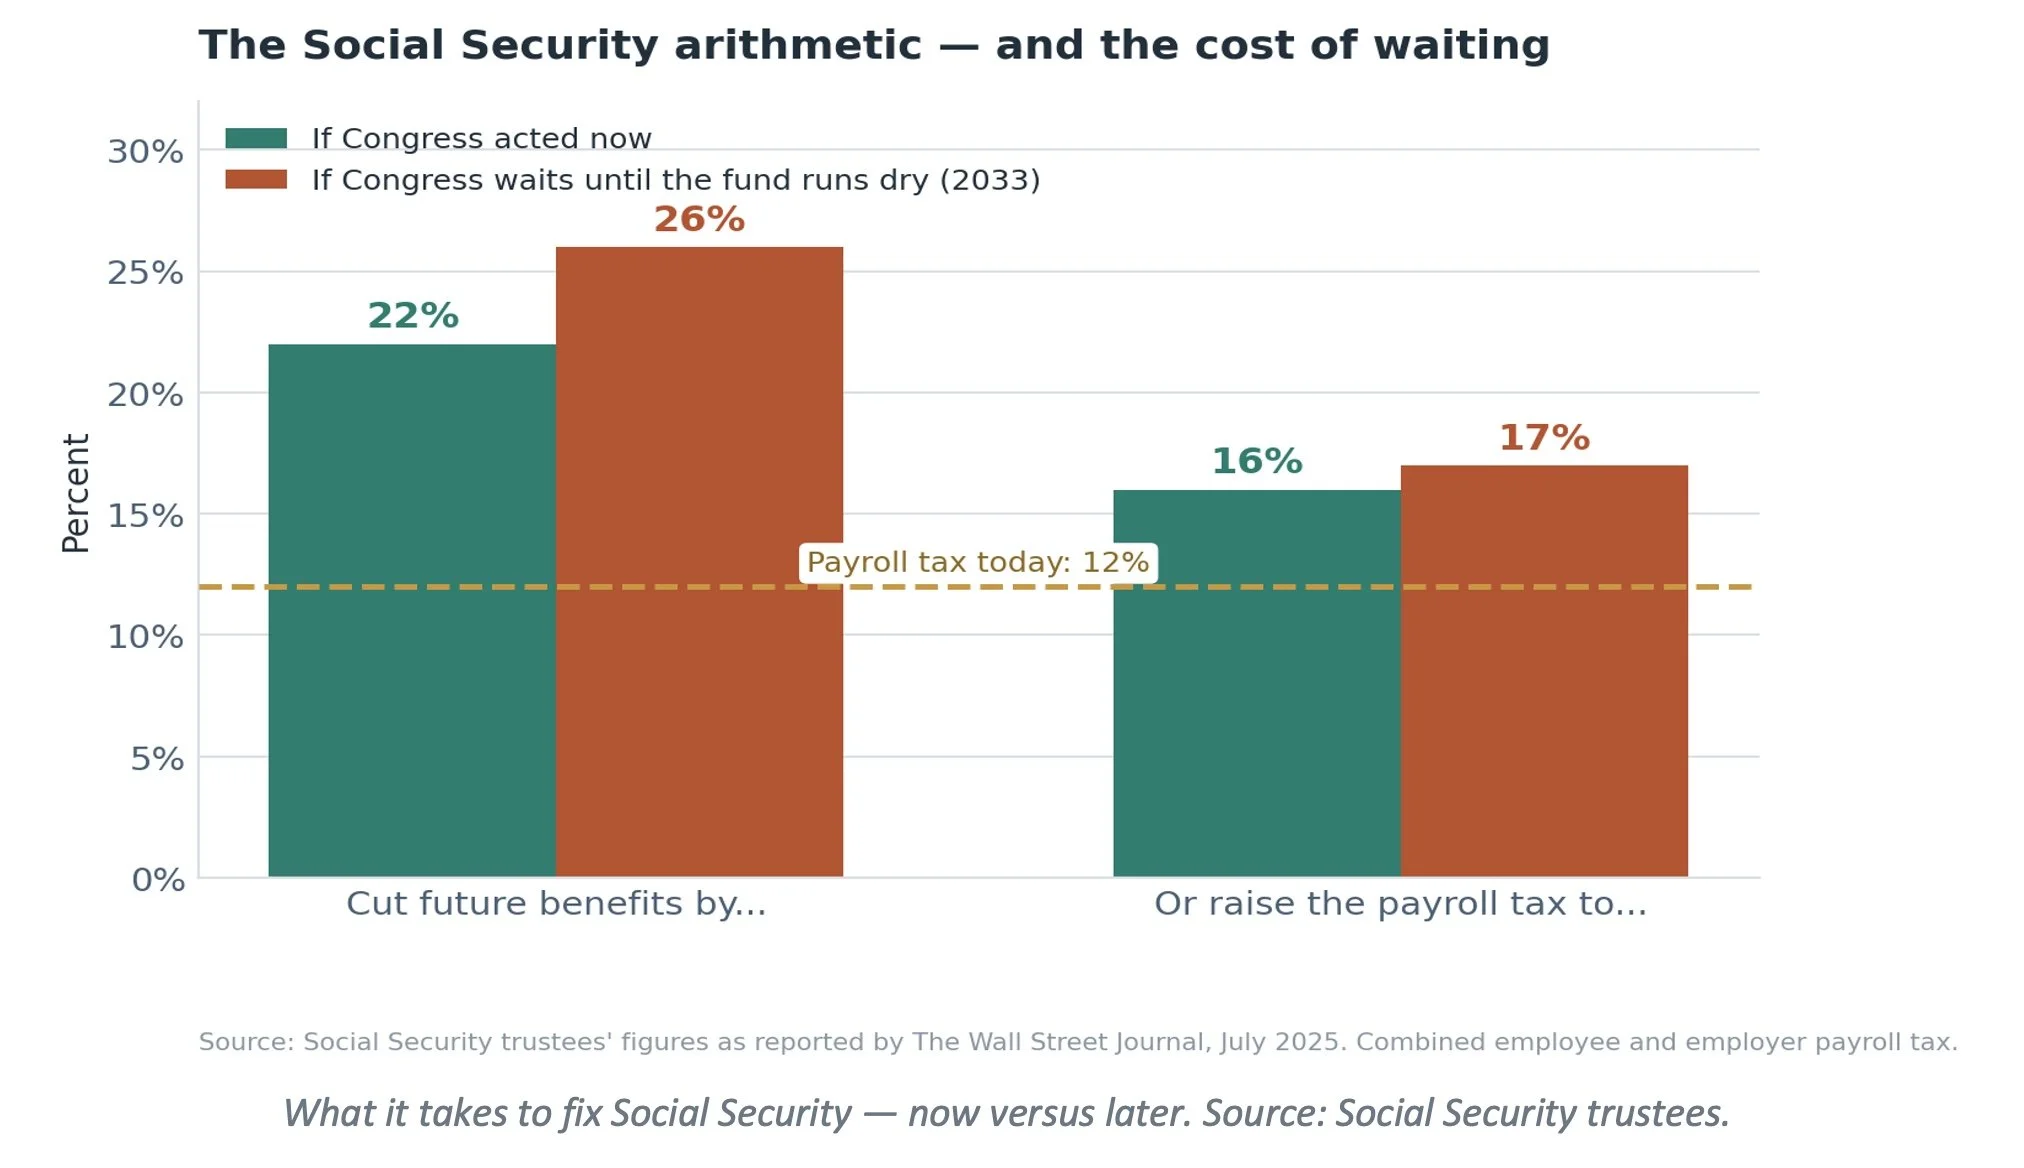
Most observers, Meyer included, expect Congress to do nothing until it has to, then act around 2032 or 2033 when the deadline is unavoidable — and to raise payroll taxes rather than income tax rates. That distinction matters for you: payroll taxes hit earned income, which means working high earners and business owners feel it most, while investment income is generally not subject to payroll taxes.
What this should and shouldn't change for YOU
It is not a reason to sell. Investors have been warned of a debt-driven collapse continuously since the 1980s, while diversified portfolios grew substantially. This is a slow pressure, not a dated event, and it has never been a useful market-timing signal.
It is a strong reason to do tax planning now. If taxes are more likely to rise than fall, then every dollar moved into a Roth today, every gain realized in a low-bracket year, and every decision about when to recognize income is worth more than it looks. This is the piece of the debt story you can actually act on.
It is also a reason to check a few things in the portfolio. How much interest-rate risk your bonds carry, whether you're taking advantage of safe bonds finally paying a real return above inflation, and whether you're diversified across asset types rather than concentrated in one space.
The bottom line: $40 trillion is a milestone, not an emergency.
Nothing broke the day the number changed. What deserves your attention is the direction — and the fact that the most likely resolution is higher taxes, arriving around 2033, landing first on earned income. That is good news in one narrow sense: it is something we can plan around, and the window to do it is open now.
If you have questions about what this means for your own financial plan — particularly your Roth conversion window — let’s talk. Call Aspire Planning Associates at (925) 938-2023.
For educational purposes only; not investment, tax, or legal advice or a recommendation to buy or sell any security. Projections are estimates, not guarantees, and no assurance is given that any projected legislative or policy outcome will occur. Diversification does not ensure a profit or protect against loss. All investing involves risk, including possible loss of principal. Bond prices fall when interest rates rise. Past performance does not indicate future results. Please consult your tax or legal professional before acting. Views attributed to Fritz Meyer are his own. Sources: U.S. Treasury, Federal Reserve, Congressional Budget Office, Committee for a Responsible Federal Budget, OECD Revenue Statistics, Social Security trustees, Freddie Mac, and news reporting including Newsweek, as of August 21, 2026. Commentary on the fiscal impact of specific legislation reflects the views of this firm and the analysts cited, not a political endorsement.